Generates calendar with monthly facets by:
Padding event list with any missing days via
fill_missing_units()Calculating variables for calendar layout via
calc_calendar_vars()Returning a ggplot object as per Details.
Usage
gg_facet_wrap_months(
  .events_long,
  date_col,
  locale = NULL,
  week_start = NULL,
  nrow = NULL,
  ncol = NULL,
  .geom = list(geom_tile(color = "grey70", fill = "transparent"), geom_text(nudge_y =
    0.25)),
  .scale_coord = list(scale_y_reverse(), scale_x_discrete(position = "top"),
    coord_fixed(expand = TRUE)),
  .theme = list(theme_bw_tilecal()),
  .other = list()
)
Arguments
- .events_long
long format calendar event data
- date_col
column containing calendar unit dates
- locale
locale to use for day names. Default to current locale.
- week_start
day on which week starts following ISO conventions: 1 means Monday and 7 means Sunday (default). When
label = FALSEandweek_start = 7, the number returned for Sunday is 1, for Monday is 2, etc. Whenlabel = TRUE, the returned value is a factor with the first level being the week start (e.g. Sunday ifweek_start = 7). You can setlubridate.week.startoption to control this parameter globally.- nrow, ncol
Number of rows and columns.
- .geom, .scale_coord, .theme, .other
Customisable lists of ggplot2 components to add to the plot. An empty
list()leaves the plot unmodified.
Details
Returns a ggplot with the following fixed components using calculated layout variables:
aes()mapping:xis day of week,yis week in month,labelis day of month
facet_wrap()by monthlabs()to remove axis labels for calculated layout variables
and default customisable components:
geom_tile(),geom_text()to label each day which inherit calculated variablesscale_y_reverse()to order day in month correctlyscale_x_discrete()to position weekday labelscoord_fixed()to square each tiletheme_bw_tilecal()to apply sensible theme defaults
To modify components alter the .geom and .scale_coord,
which inherit the calculate layout mapping by default
(via the ggplot2 inherit.aes argument).
To additional components use the ggplot + function as normal,
or pass components to the .other argument.
This can be used to add interactive geoms (e.g. from ggiraph)
To modify the theme, use the ggplot + function as normal,
or add additional elements to the list in .theme.
To remove any of the optional components, set the argument to any empty list()
Examples
library(dplyr)
#>
#> Attaching package: ‘dplyr’
#> The following objects are masked from ‘package:stats’:
#>
#> filter, lag
#> The following objects are masked from ‘package:base’:
#>
#> intersect, setdiff, setequal, union
library(ggplot2)
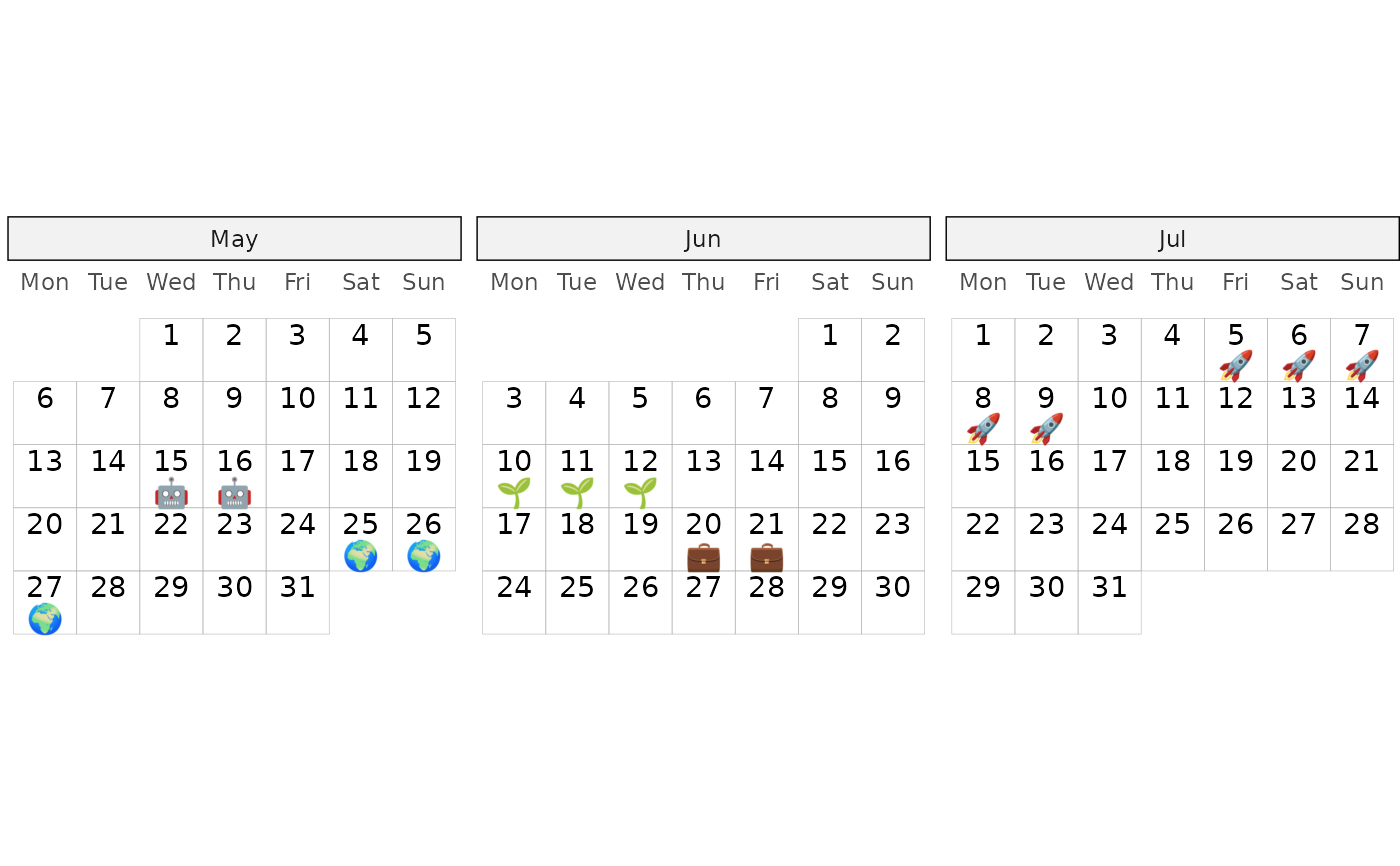
demo_events_gpt |>
reframe_events(startDate, endDate) |>
group_by(unit_date) |>
slice_min(order_by = duration) |>
gg_facet_wrap_months(unit_date) +
geom_text(aes(label = event_emoji), nudge_y = -0.25, na.rm = TRUE)