viz-country-concord
cynthiahqy
2022-11-10
Last updated: 2022-11-10
Checks: 7 0
Knit directory: viz-panel-maps/
This reproducible R Markdown analysis was created with workflowr (version 1.7.0). The Checks tab describes the reproducibility checks that were applied when the results were created. The Past versions tab lists the development history.
Great! Since the R Markdown file has been committed to the Git repository, you know the exact version of the code that produced these results.
Great job! The global environment was empty. Objects defined in the global environment can affect the analysis in your R Markdown file in unknown ways. For reproduciblity it’s best to always run the code in an empty environment.
The command set.seed(20221110) was run prior to running
the code in the R Markdown file. Setting a seed ensures that any results
that rely on randomness, e.g. subsampling or permutations, are
reproducible.
Great job! Recording the operating system, R version, and package versions is critical for reproducibility.
Nice! There were no cached chunks for this analysis, so you can be confident that you successfully produced the results during this run.
Great job! Using relative paths to the files within your workflowr project makes it easier to run your code on other machines.
Great! You are using Git for version control. Tracking code development and connecting the code version to the results is critical for reproducibility.
The results in this page were generated with repository version 521aa4d. See the Past versions tab to see a history of the changes made to the R Markdown and HTML files.
Note that you need to be careful to ensure that all relevant files for
the analysis have been committed to Git prior to generating the results
(you can use wflow_publish or
wflow_git_commit). workflowr only checks the R Markdown
file, but you know if there are other scripts or data files that it
depends on. Below is the status of the Git repository when the results
were generated:
Ignored files:
    Ignored:    .DS_Store
    Ignored:    .Rhistory
    Ignored:    .Rproj.user/
    Ignored:    README_files/
Note that any generated files, e.g. HTML, png, CSS, etc., are not included in this status report because it is ok for generated content to have uncommitted changes.
These are the previous versions of the repository in which changes were
made to the R Markdown (analysis/viz-country-concord.Rmd)
and HTML (docs/viz-country-concord.html) files. If you’ve
configured a remote Git repository (see ?wflow_git_remote),
click on the hyperlinks in the table below to view the files as they
were in that past version.
| File | Version | Author | Date | Message |
|---|---|---|---|---|
| Rmd | 521aa4d | cynthiahqy | 2022-11-10 | move country-concord code into separate folder |
| html | 521aa4d | cynthiahqy | 2022-11-10 | move country-concord code into separate folder |
| Rmd | b7be0ac | cynthiahqy | 2022-11-10 | wflow_git_commit(all = TRUE) |
| html | b7be0ac | cynthiahqy | 2022-11-10 | wflow_git_commit(all = TRUE) |
| html | 1954472 | cynthiahqy | 2022-11-10 | Build site. |
| Rmd | 75b45e3 | cynthiahqy | 2022-11-10 | wflow_publish("analysis/viz-country-concord.Rmd") |
Attempts at visualising panel maps
This repo contains a collection of ggplot experiments for visualising
panel maps use in {conformr}
documentation
Experiments
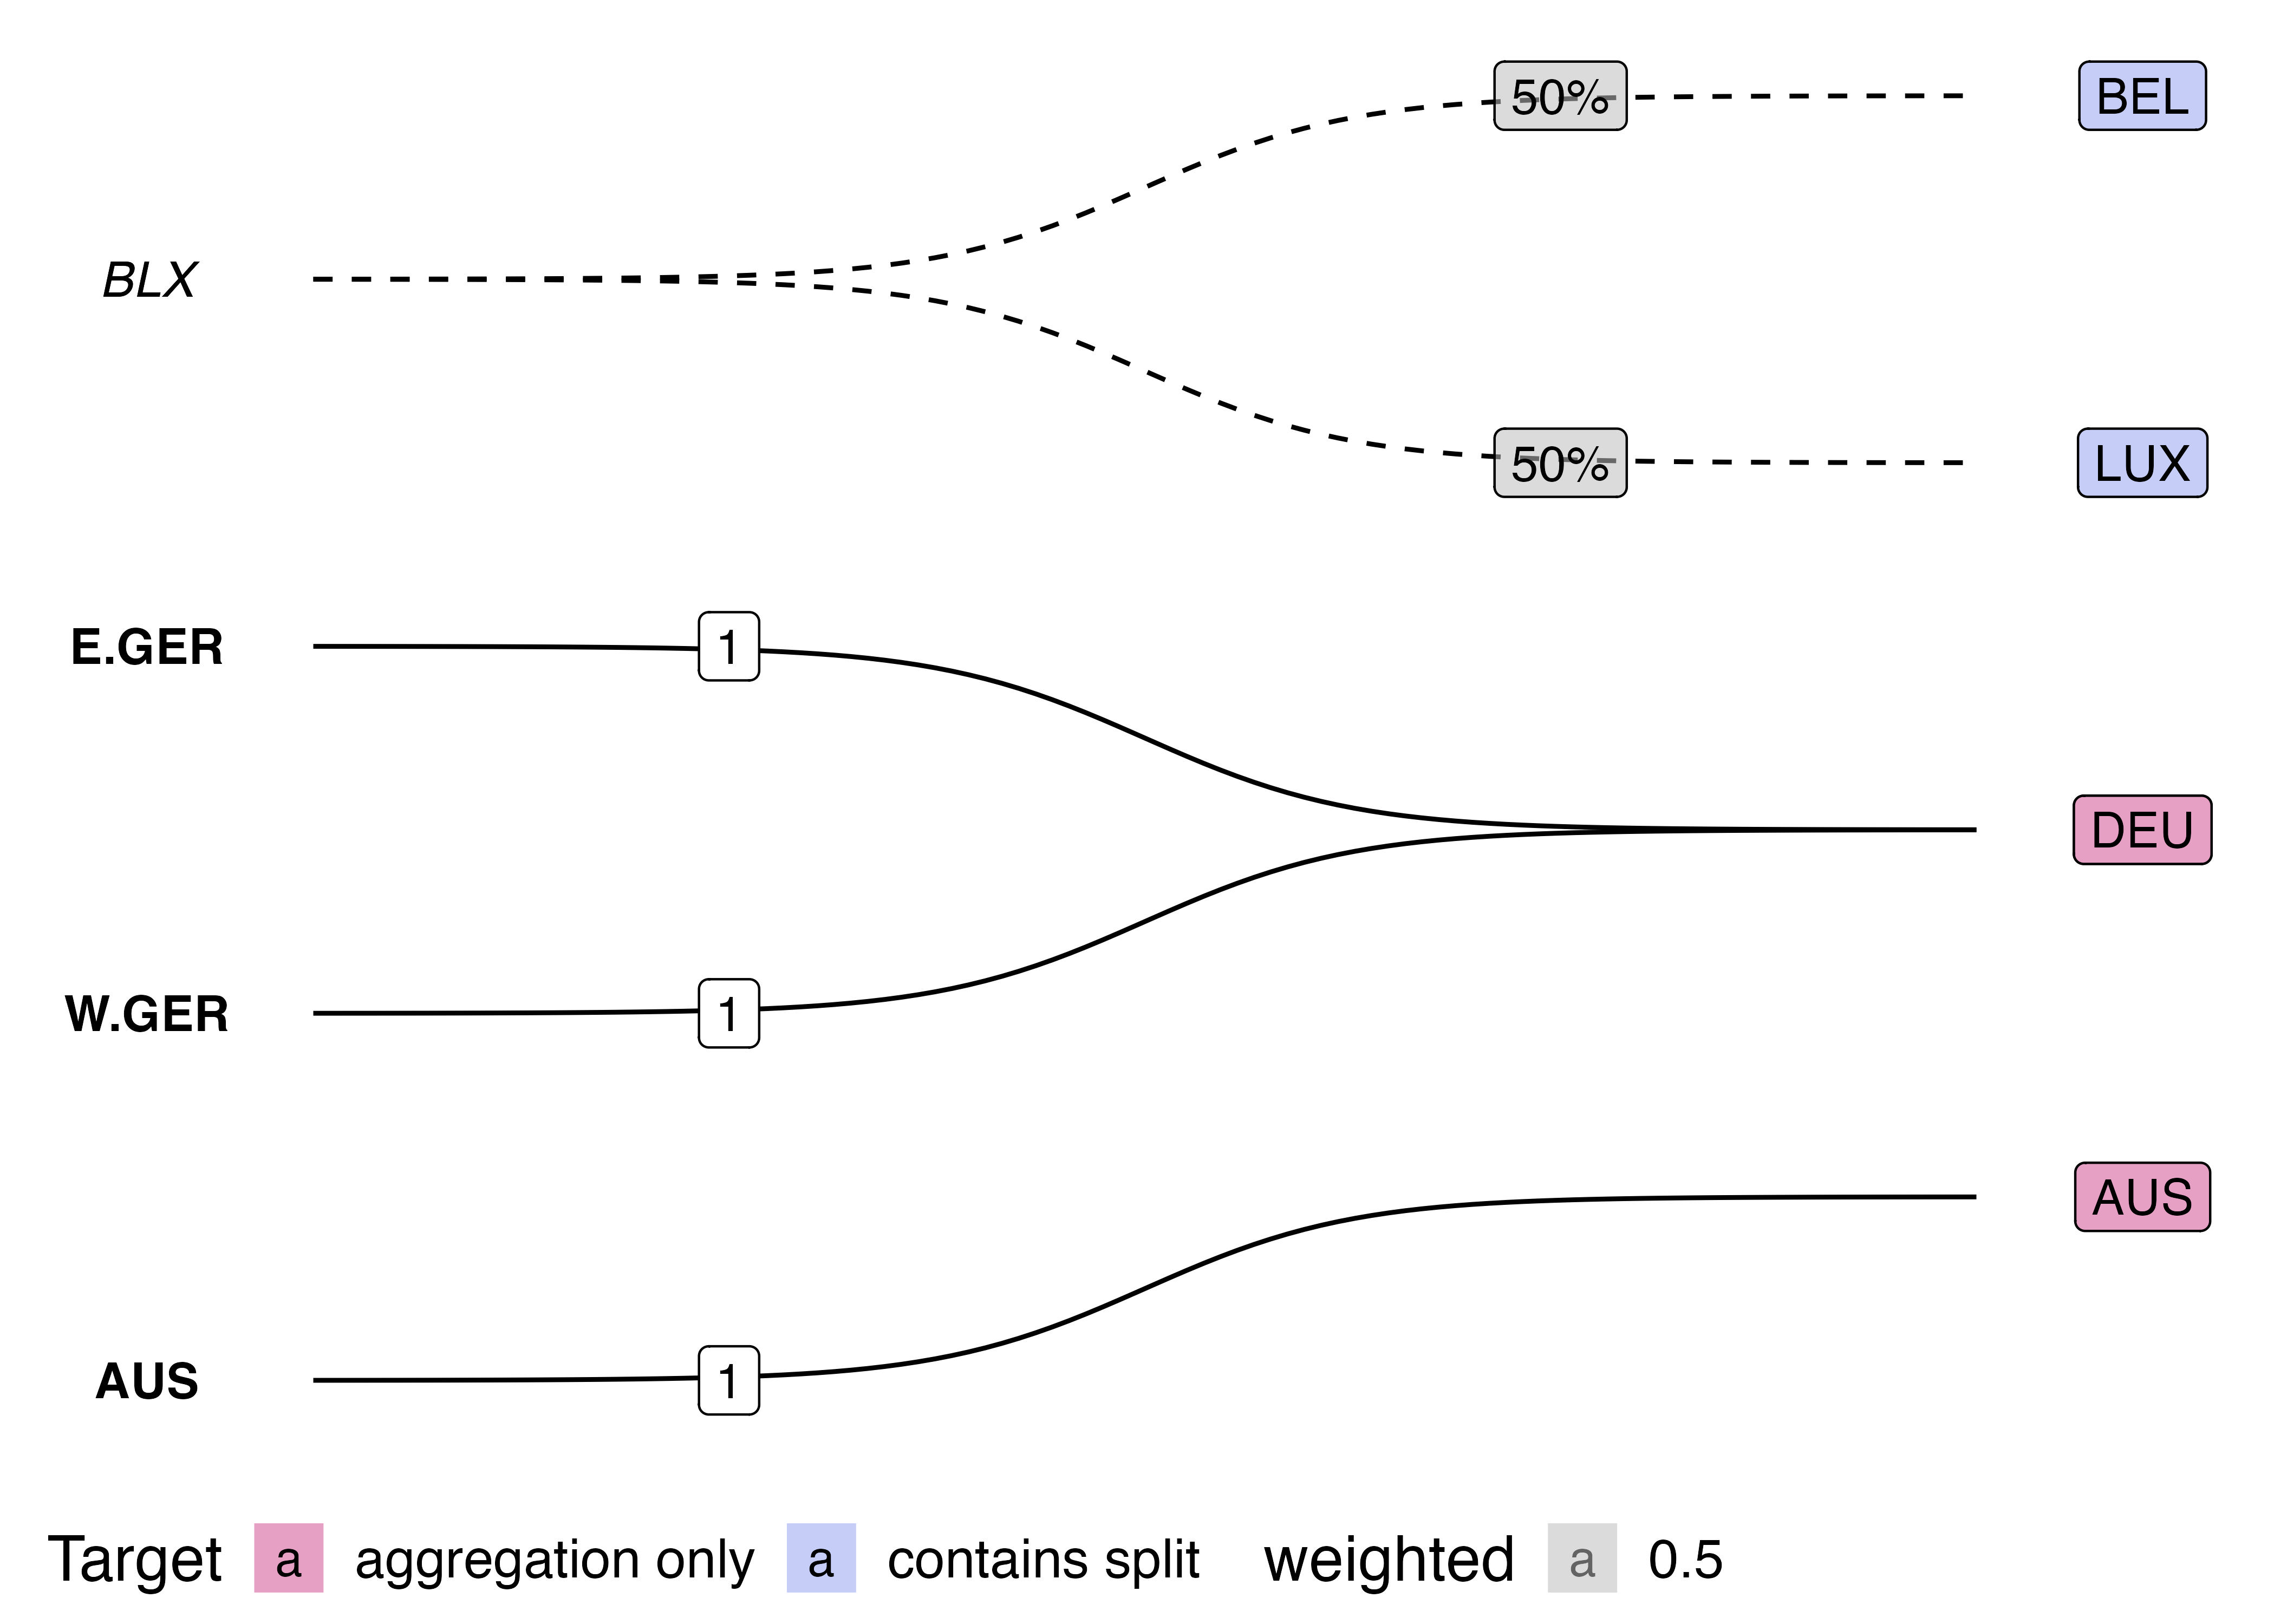
This is this mapping (recorded as graph edges) I tried to visualise:
# A tibble: 5 × 3
  from  to    weighted
  <chr> <chr>    <dbl>
1 BLX   BEL        0.5
2 BLX   LUX        0.5
3 E.GER DEU        1
4 W.GER DEU        1
5 AUS   AUS        1
ggplot extensions I experimented with (code in R/
folder):
{ggraph}: way too flexible, no sensible way to keep thefrom, andtonodes lined up. Found some good{tidygraph}and{ggraph}resources though:{ggsankey}: keepsfromandtonodes stacked in “stages”, and connects nodes in each stage with “flow” ribbons{ggalluvial}: terminology in documentation (lodes/alluvia/stratum..) was a bit difficult to follow (use cheatsheets!); too rigid for my purposes, and rescaling ofweightedas flows between nodes obscures the weight information{ggbump::geom_bump}: removes the “flow” to line-width connection from sankey/alluvials, and adds some flexibility for node positioning, but is annoyingly restrictive requirements foraes()mapping – couldn’t quite map data into “rank” format{ggbump::geom_sigmoid}: more flexible geom that probably powersgeom_bump(), just requires calculation of starting and ending x,y coordinates for each set/stage of nodes.
Aside on errors when reproducing the map with sigmoid curves from
ggbump readme:
- original code vs. modified code for sf > 1.0
- need to turn off s2 spherical geometry using
sf_use_s2(FALSE)– see github issue - might have been calling the wrong version of
format()but changingdigits = 0todigits = 1seemed to fix the error
Visualisation Results
labelled sigmoid plot: code
- renormalising the nodes/labels to fit within a range there is not enough space (use this code)
source("code/viz-country-concord/ggbump-sigmoid-graph-edges.R")Saving 7 x 5 in image
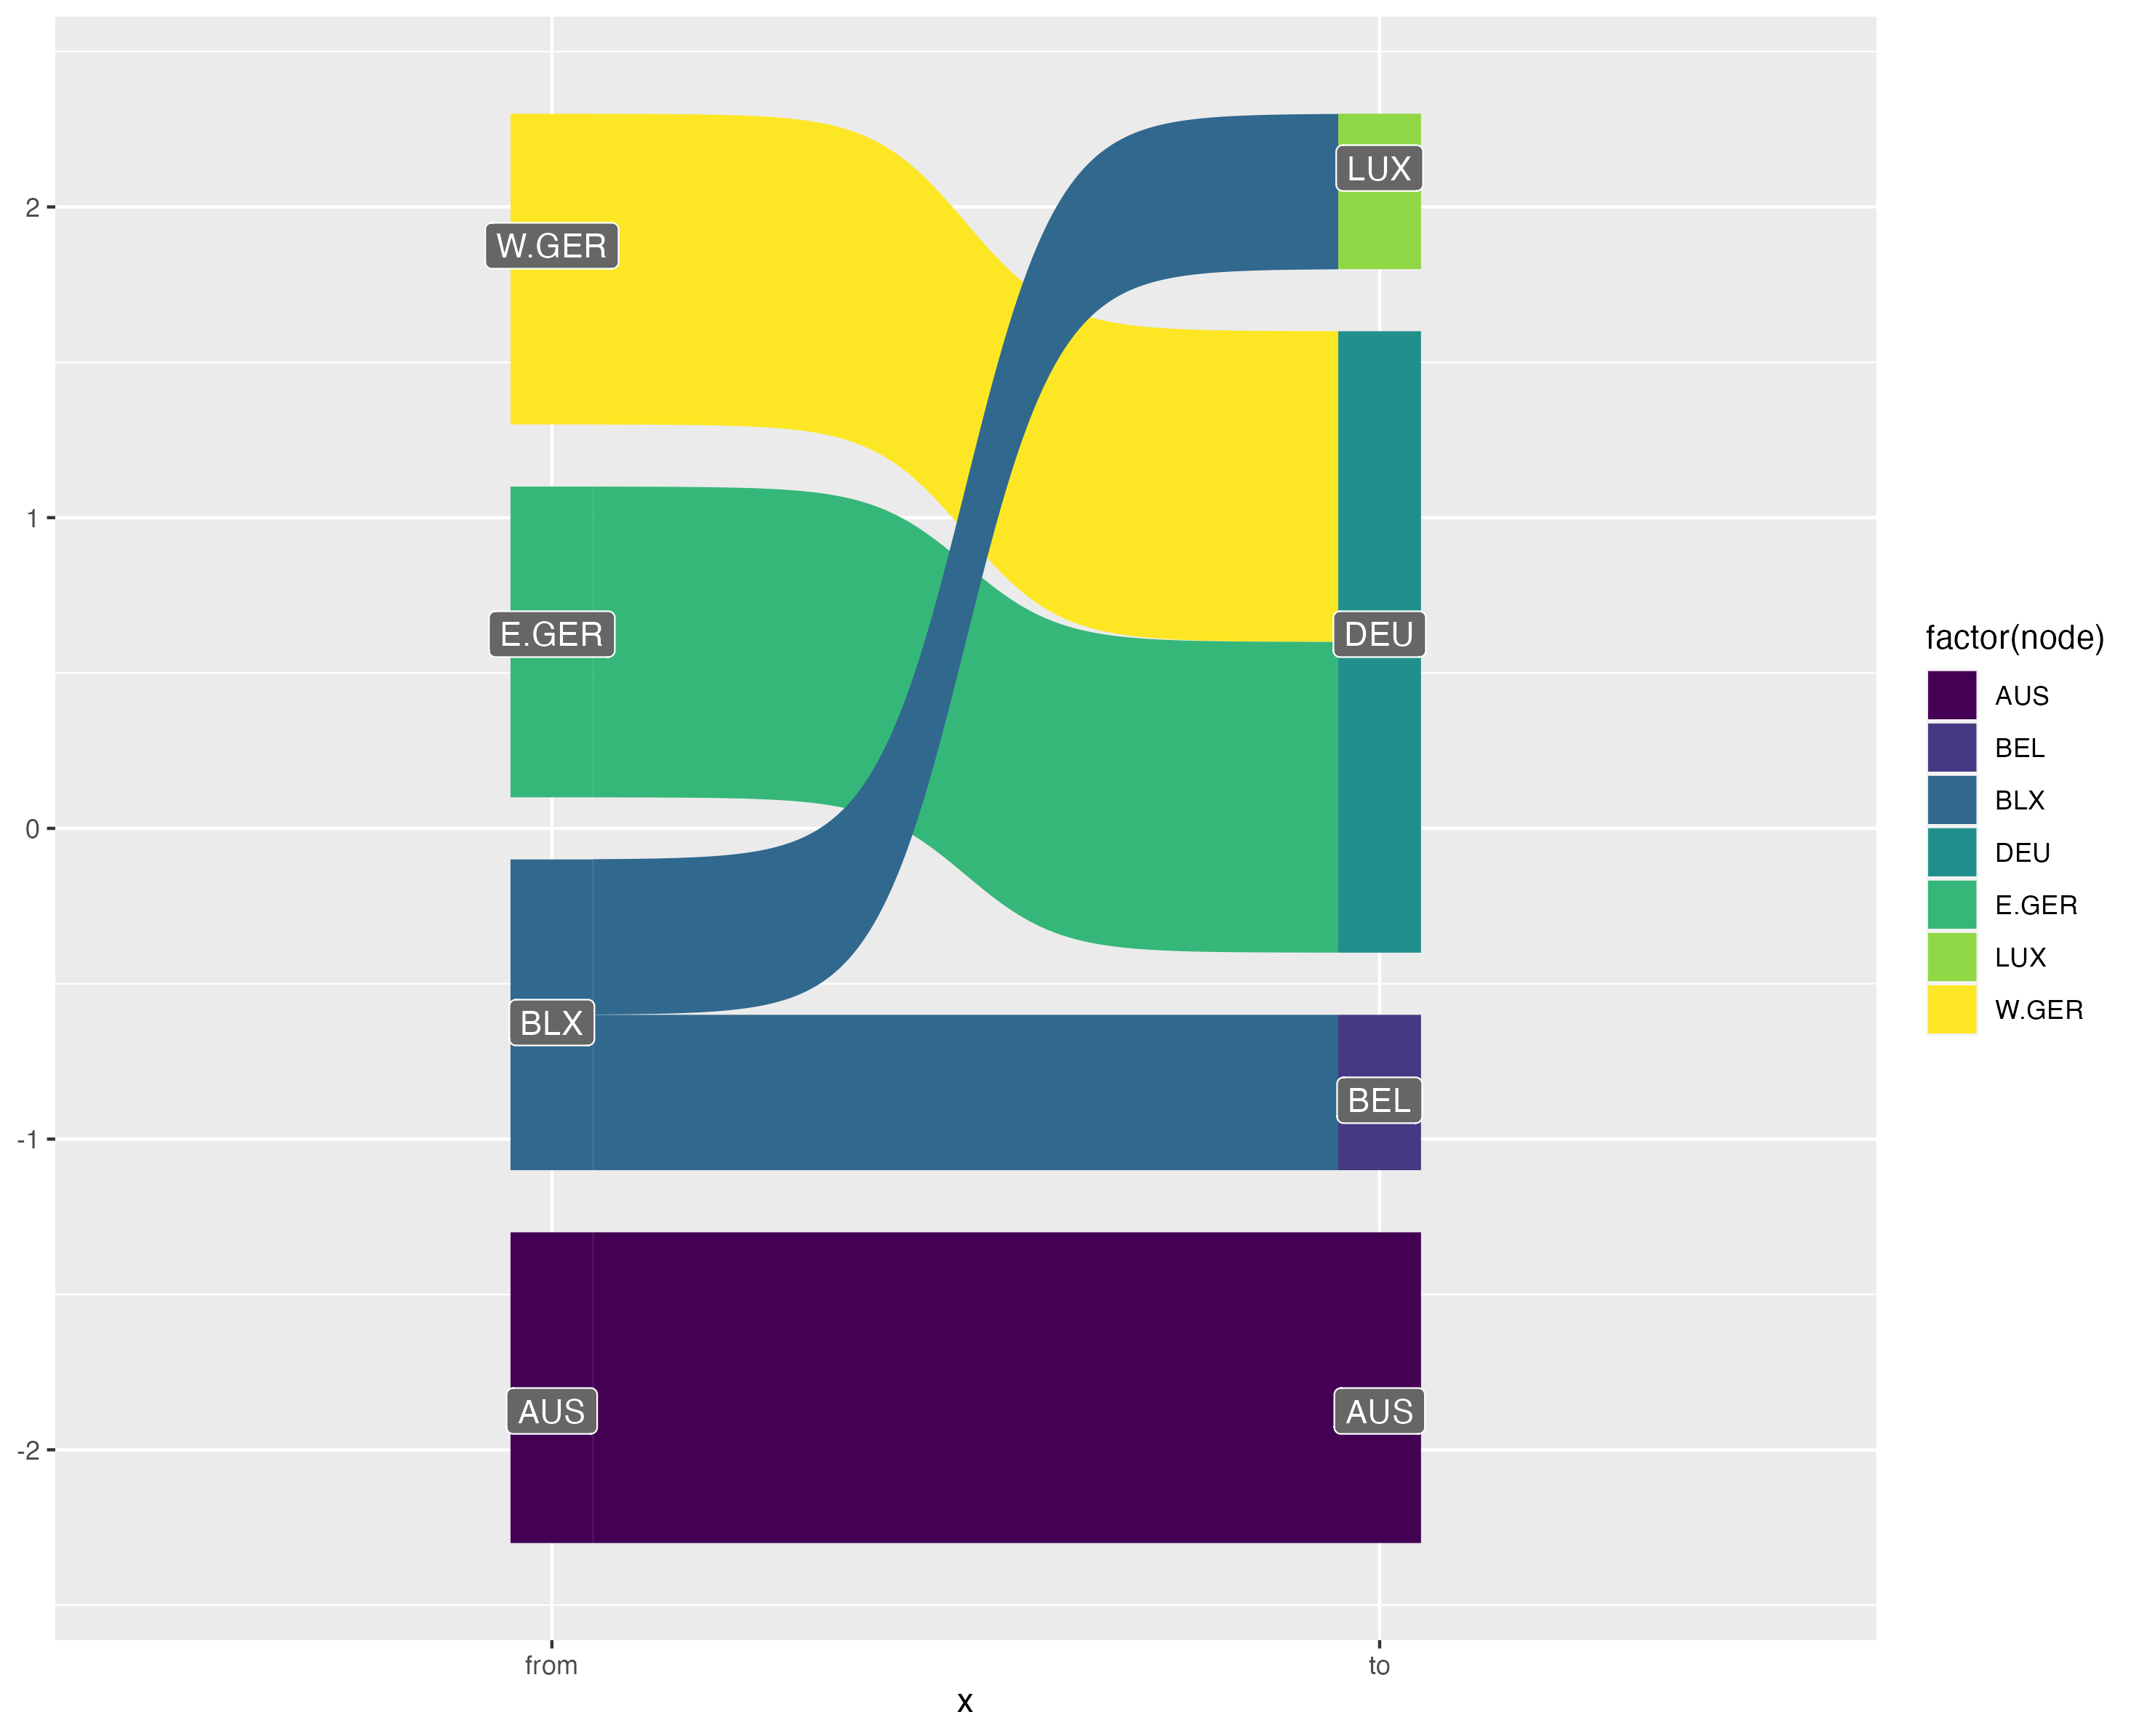
sankey flow diagram using {ggsankey}: code

sankey flow diagram
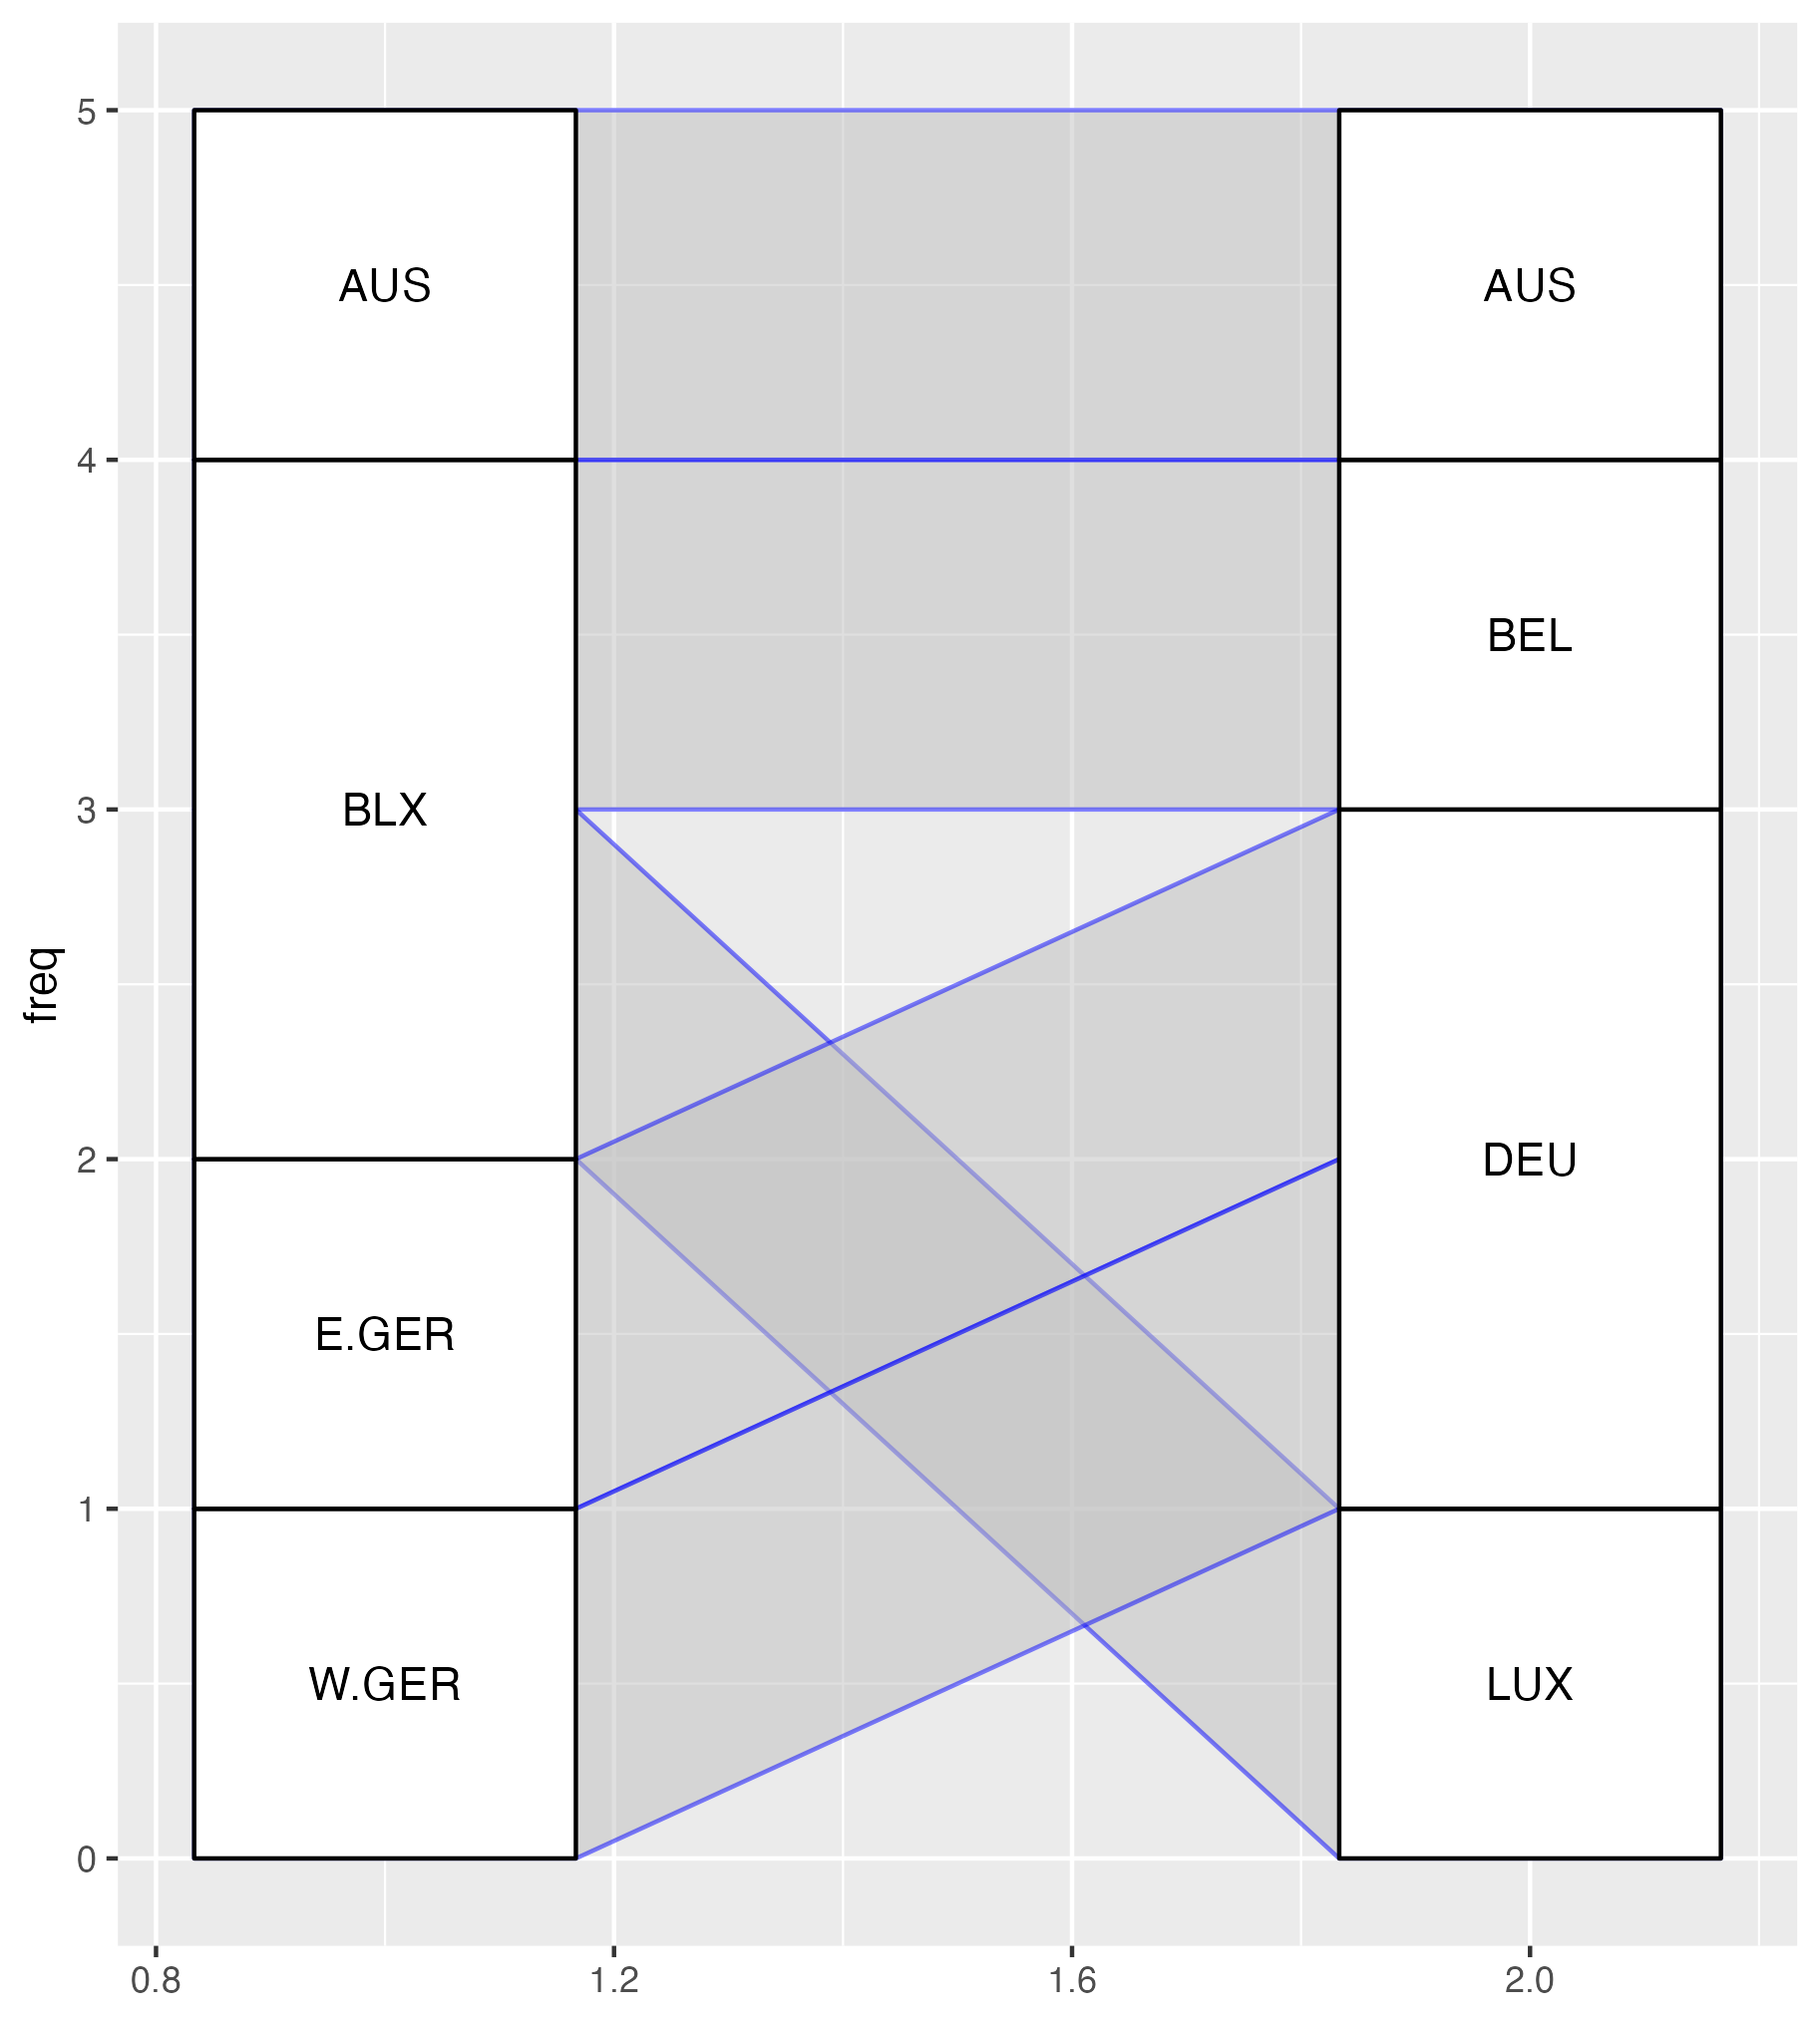
alluvial plot using {ggalluvial}: code

alluvial plot
Matrix Equivalence and Panel Map Conditions
Graphs can also be represented in matrix form:
pm_mtx <- source("code/viz-country-concord/edges-to-matrix.R")$value
pm_mtx
BEL LUX DEU AUS
BLX 0.5 0.5 0 0
E.GER 0.0 0.0 1 0
W.GER 0.0 0.0 1 0
AUS 0.0 0.0 0 1Notice the condition that weights sum to one can be checked by simply summing up each row:
## weights sum to one
col_ones <- matrix(1, nrow=nrow(pm_mtx))
pm_mtx %*% col_ones == 1
[,1]
BLX TRUE
E.GER TRUE
W.GER TRUE
AUS TRUEapply the transformation:
src_val <- matrix(100, nrow=nrow(pm_mtx))
(new_val <- t(pm_mtx) %*% src_val)
[,1]
BEL 50
LUX 50
DEU 200
AUS 100Notice that we get equivalent totals for “free” because the weights in each row sum to one:
sum(src_val) == sum(new_val)[1] TRUEThe coverage test is equivalent to a conformability condition.
## add an extra source class
bad_x <- rep_len(100, nrow(pm_mtx) + 1)
## now we cannot use the panel map
t(pm_mtx) %*% as.matrix(bad_x)
Error in t(pm_mtx) %*% as.matrix(bad_x): non-conformable argumentsPanel maps are uni-directional except for one-from-one mappings
(pm_mtx %*% new_val) == src_val [,1]
BLX FALSE
E.GER FALSE
W.GER FALSE
AUS TRUE
sessionInfo()R version 4.2.1 (2022-06-23)
Platform: x86_64-apple-darwin17.0 (64-bit)
Running under: macOS Big Sur ... 10.16
Matrix products: default
BLAS: /Library/Frameworks/R.framework/Versions/4.2/Resources/lib/libRblas.0.dylib
LAPACK: /Library/Frameworks/R.framework/Versions/4.2/Resources/lib/libRlapack.dylib
locale:
[1] en_AU.UTF-8/en_AU.UTF-8/en_AU.UTF-8/C/en_AU.UTF-8/en_AU.UTF-8
attached base packages:
[1] stats graphics grDevices utils datasets methods base
other attached packages:
[1] ggbump_0.1.0 ggplot2_3.3.6 tidyr_1.2.1 dplyr_1.0.10
[5] tibble_3.1.8 workflowr_1.7.0
loaded via a namespace (and not attached):
[1] tidyselect_1.2.0 xfun_0.34 bslib_0.4.1 purrr_0.3.5
[5] colorspace_2.0-3 vctrs_0.5.0 generics_0.1.3 htmltools_0.5.3
[9] yaml_2.3.6 utf8_1.2.2 rlang_1.0.6 jquerylib_0.1.4
[13] later_1.3.0 pillar_1.8.1 glue_1.6.2 withr_2.5.0
[17] DBI_1.1.3 lifecycle_1.0.3 stringr_1.4.1 munsell_0.5.0
[21] gtable_0.3.1 ragg_1.2.2 evaluate_0.16 labeling_0.4.2
[25] knitr_1.40 callr_3.7.3 fastmap_1.1.0 httpuv_1.6.6
[29] ps_1.7.2 fansi_1.0.3 Rcpp_1.0.9 promises_1.2.0.1
[33] scales_1.2.1 cachem_1.0.6 jsonlite_1.8.2 farver_2.1.1
[37] systemfonts_1.0.4 fs_1.5.2 textshaping_0.3.6 digest_0.6.30
[41] stringi_1.7.8 processx_3.8.0 getPass_0.2-2 cowplot_1.1.1
[45] rprojroot_2.0.3 grid_4.2.1 here_1.0.1 cli_3.4.1
[49] tools_4.2.1 magrittr_2.0.3 sass_0.4.2 wesanderson_0.3.6
[53] pacman_0.5.1 whisker_0.4 pkgconfig_2.0.3 ellipsis_0.3.2
[57] data.table_1.14.2 assertthat_0.2.1 rmarkdown_2.17 httr_1.4.4
[61] rstudioapi_0.14 R6_2.5.1 git2r_0.30.1 compiler_4.2.1